Activity log
Changes (events) in Infrahub are documented in the Activity log. It helps you see which objects were impacted, when a change was made, and who made it. It can be used to troubleshoot unforeseen changes, audit previous operations, and comprehend the order of updates across various branches.
To export these events to an external SIEM or centralized logging system, see log forwarding.
Because figuring out who may view which changes requires complicated query requirements, we have currently set aside the permission framework for this functionality.
The activity log, in general, compiles and arranges events from several branches and objects into a single timeline:
- Global view: A consolidated list of all branch-wide activities (events).
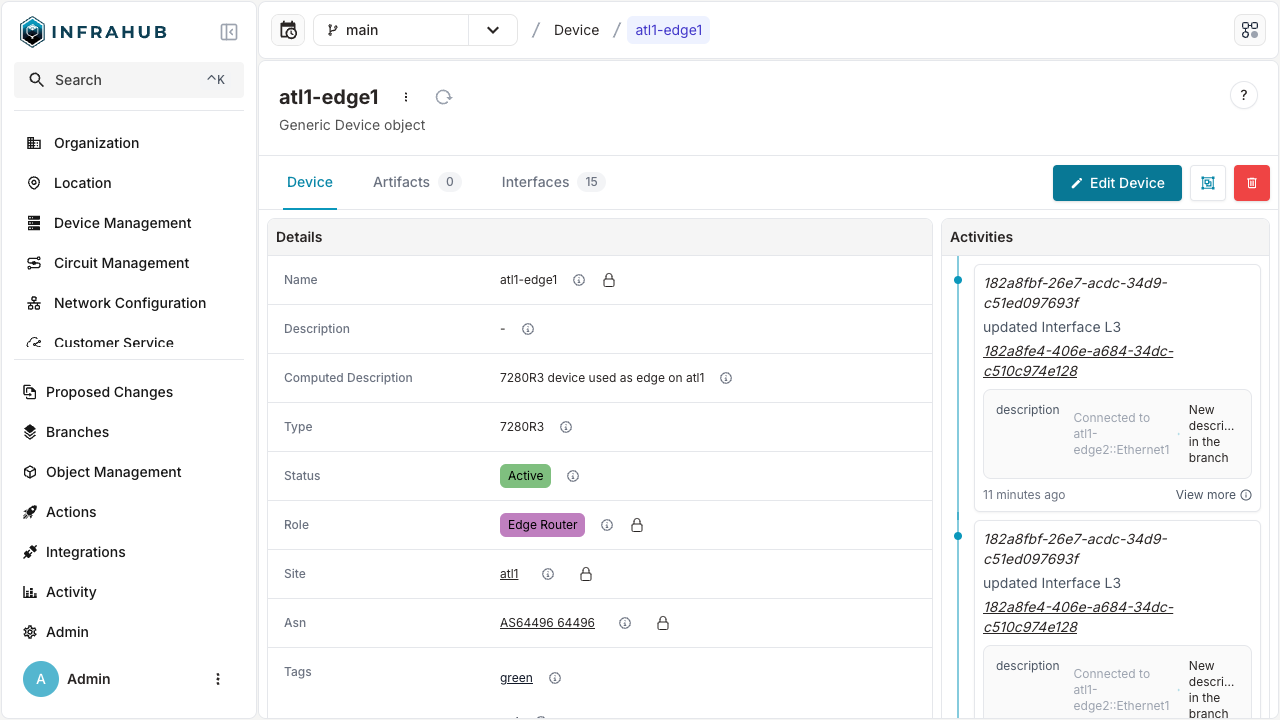
- Object-level view: A timeline that is particular to a single object and only displays events that are pertinent to that object.
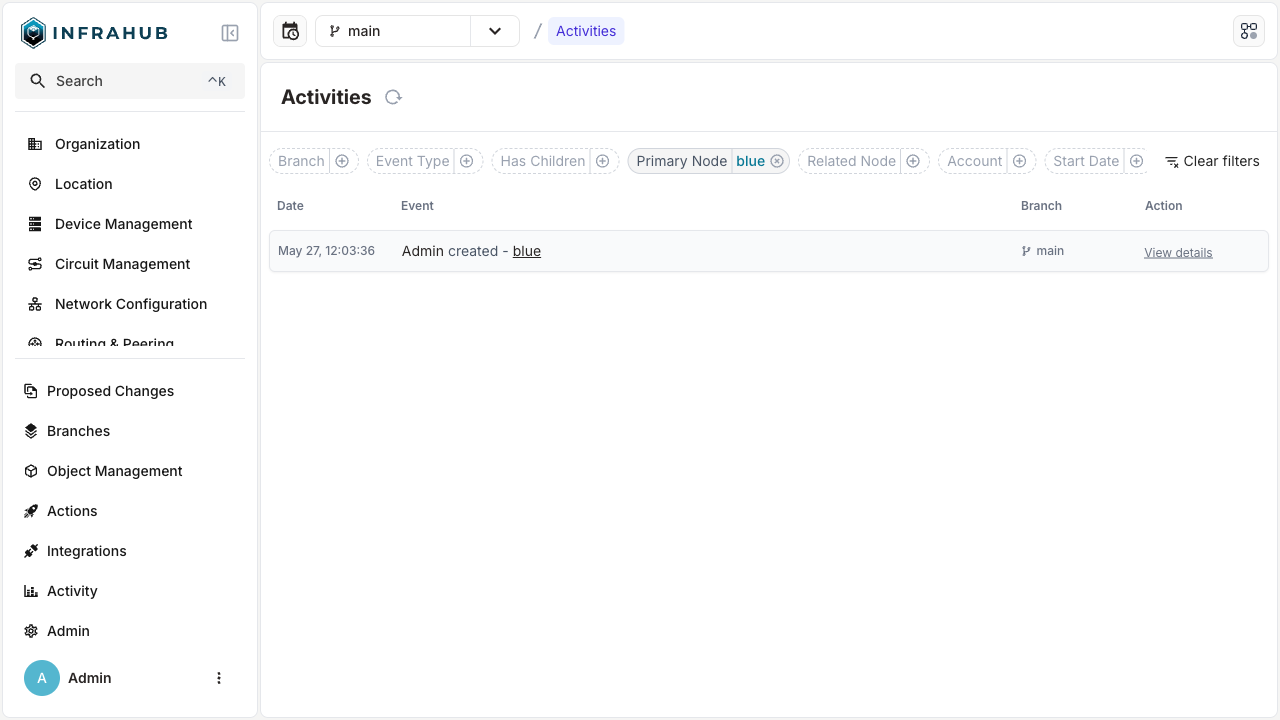
- Filtering: You can narrow down your search using a variety of filters (by branch, event type, account, principal node, linked node, date range).
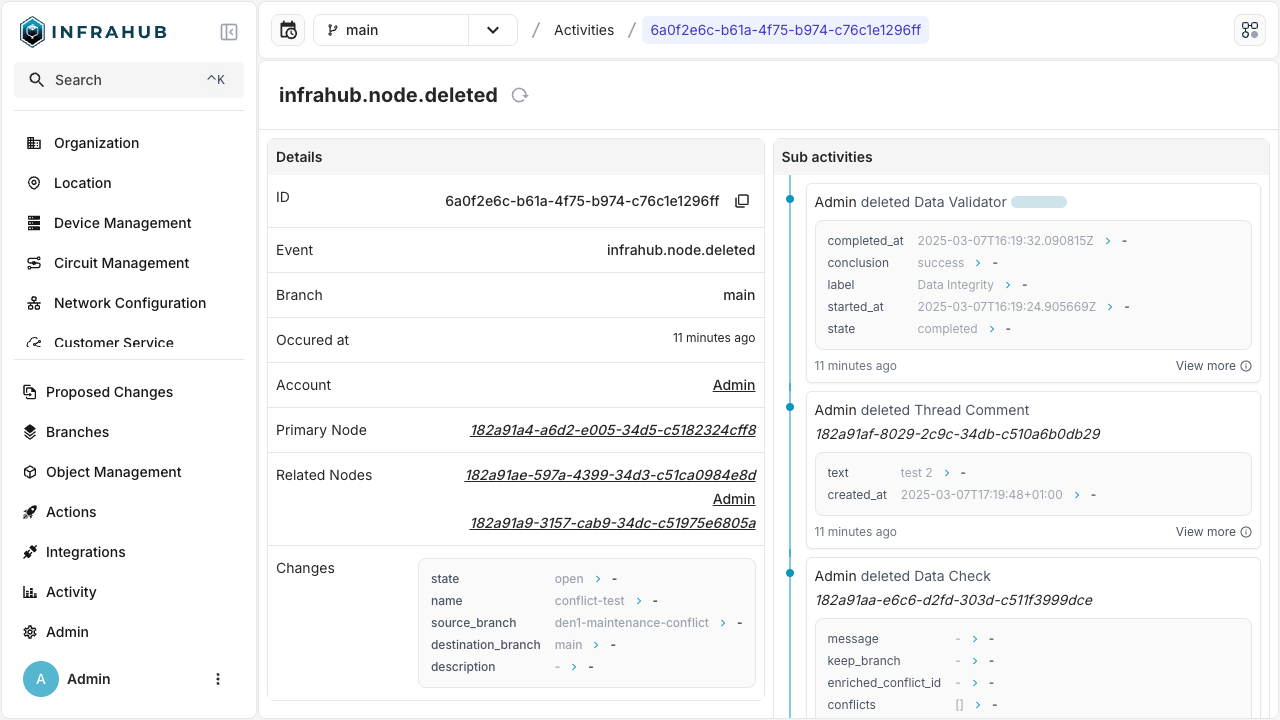
- Nested / child events: Cascade actions are observed when specific top-level events trigger additional child events.
Accessing the activity log
The activity log can be accessed in any of two ways: globally or at the object level.
- Global activity log:
- Menu location: In the main navigation, go to Activity → Activity log.
- URL:
https://<your-instance>/activities
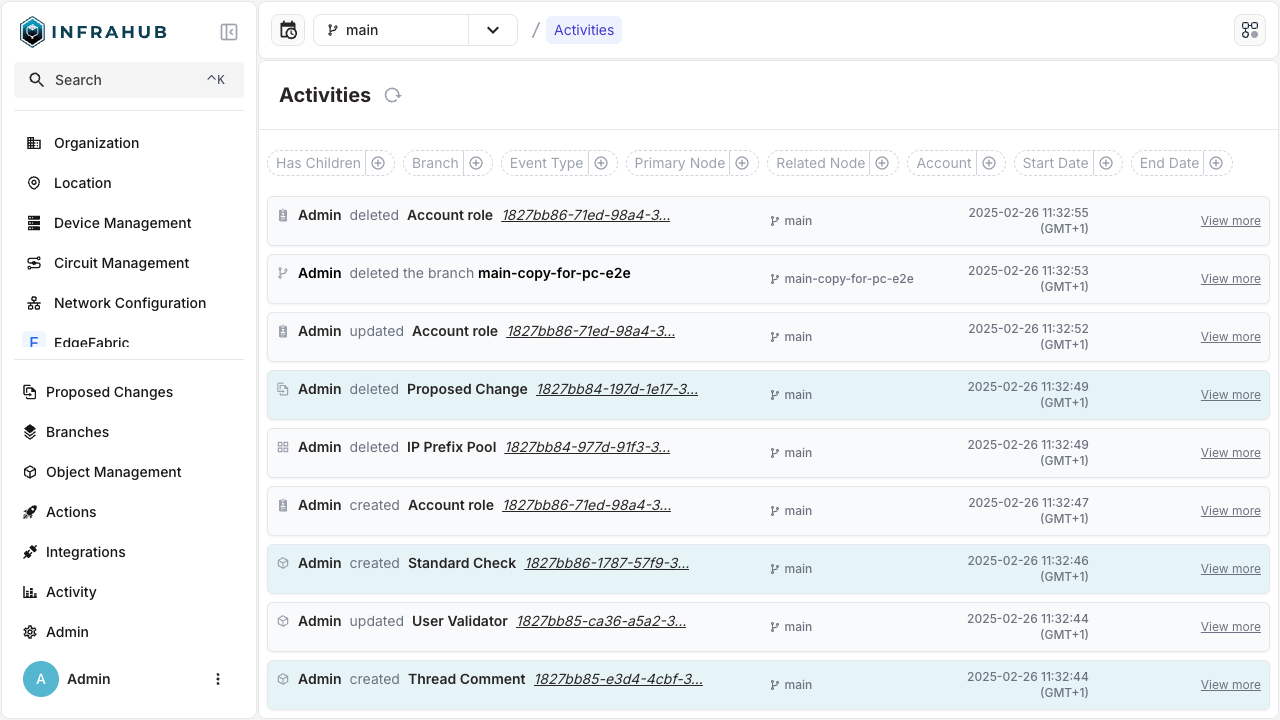
The activity log's date and time are determined by the local time in your browser.
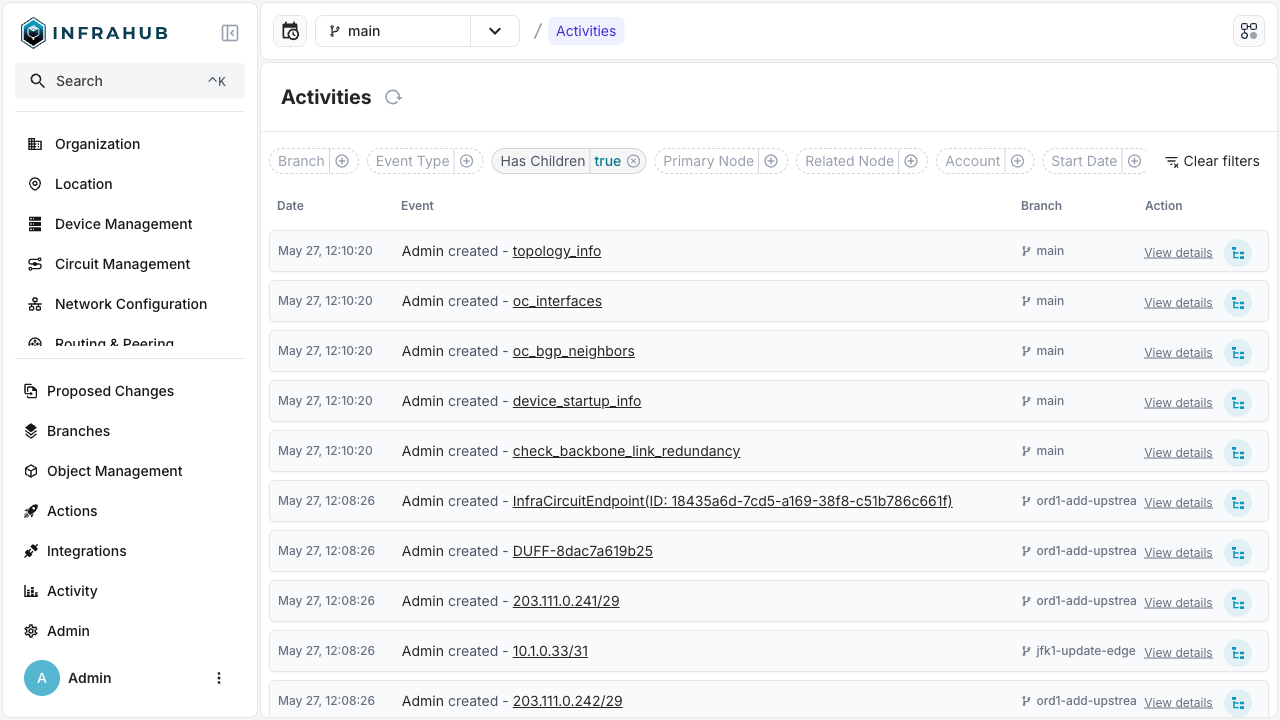
Events containing child events have an extra (blue) icon at the end of the line.
- Object-level activity log:
- Node / object detail pages: Within a node's detail view (for example an IP address or device), you'll see a right-hand "Activity logs" panel or a separate tab.
Filters and search
There are several ways to hone your view in the global activity log:
- Branch: Select the branch you wish to view the events in, such as
main. - Event type: Filter by categories such as
Node Created,Branch Deleted. You can find more information in the Infrahub Events topic. - Account / user: Only display events that have been initiated by a certain account.
- Primary / related node: Highlight activities associated with a specific node.
- Has children: Whether a certain occurrence led to other smaller ones.
- Date range: Set a start and end time and date for the timeline.
Querying the activity log over the API
Use the InfrahubEvent GraphQL query to read the activity log from a script: collect every operation in an incident window, or line those operations up against the data as it stood at the time.
query IncidentEvents {
  InfrahubEvent(
    since: "2026-03-09T00:00:00Z"
    until: "2026-03-10T00:00:00Z"
    branches: ["main"]
  ) {
    count
    edges {
      node {
        id
        event
        branch
        occurred_at
        account_id
        primary_node { id kind }
      }
    }
  }
}
since defaults to 180 days back and until defaults to the current time. A query that omits since therefore returns only the last 180 days rather than the full history, and nothing in the response says so. Set since explicitly when you need events older than 180 days.
The filters available in the web interface map onto these parameters, and the query accepts several that the interface does not expose:
| Parameter | Selects |
|---|---|
since, until | Events in a time range |
branches | Events on specific branches |
account__ids | Events initiated by specific accounts |
event_type | Events matching a type, such as infrahub.node.updated |
event_type_filter | Filters specific to one event type |
primary_node__ids | Events whose primary node is one of these |
related_node__ids | Events whose related nodes include one of these |
parent__ids | Events listing one of these as a parent |
has_children | Events that did or did not trigger child events |
level | Root events (0) or a given depth of child event |
ids | Specific events by ID |
order | Sort order, descending by default |
limit, offset | Page through the results |
See Infrahub Events for the event types and the fields each one carries.
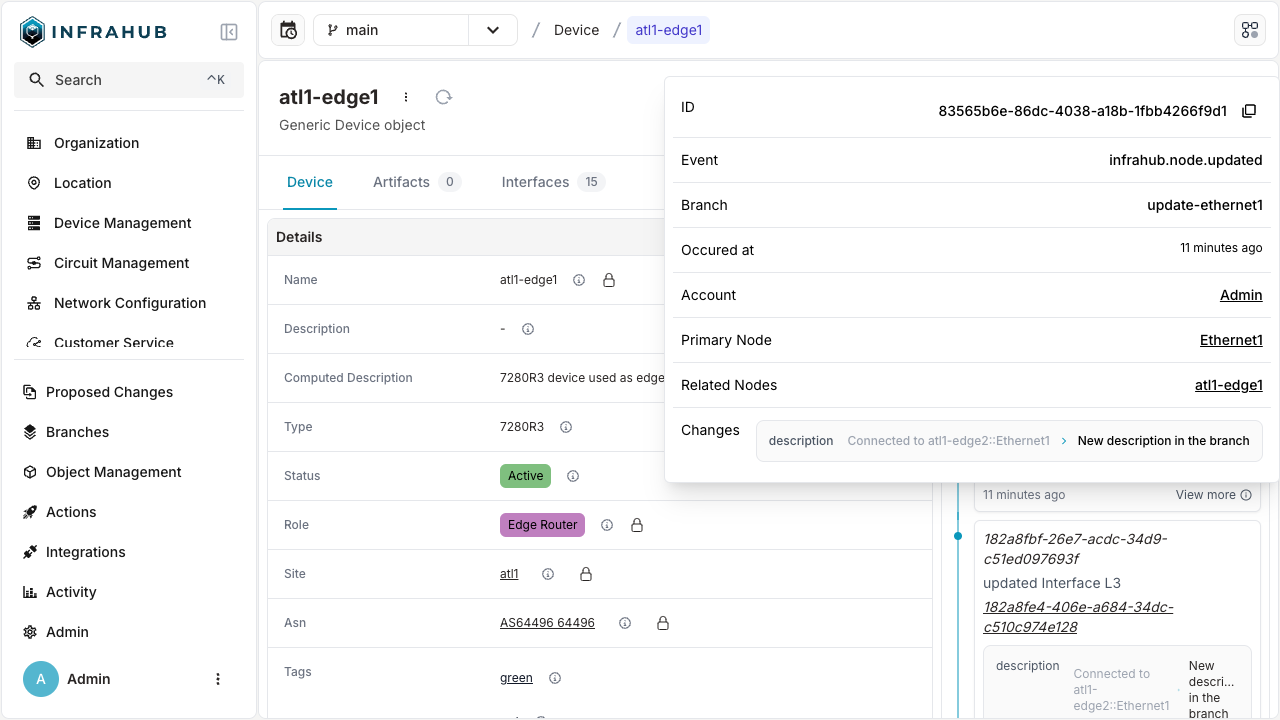
Viewing event details
If you choose View more from the global or object-level list, a separate detail page or popover will show up. Additional details are shown in this view, such as:
- Event ID: A unique UUID referencing the event.
- Event type: The type of the event, for example,
infrahub.node.updated. You can find more information in the Infrahub Events topic. - Occurred at: The exact moment the incident took place
- Account: The account that carried out the activity.
- Primary node: The primary object that the event affects.
- Related nodes: Additional affected objects.
- Changes: Any before and after adjustments to updated attributes, if any